
Activities Calendar
This guide covers how to use the Activities Calendar. The activities calendar allows you to create reports on different activities across your courses in order for you to plan your student/staff workload better.
This guide covers:
Accessing the Activities Calendar
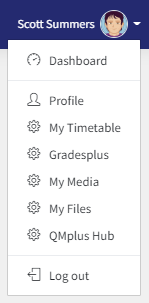
- To access the activities calendar, go to your ‘Profile Action Menu’ and click on ‘Profile’.
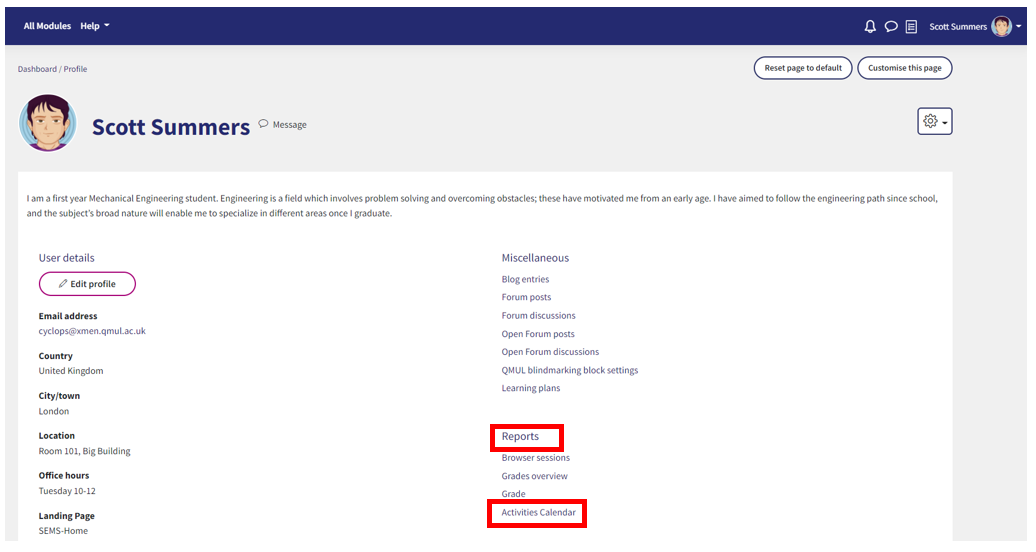
2. Under your ‘Profile’ go to the ‘Reports’ section and click on the ‘Activities Calendar’.
Using the Activities Calendar to Create Reports
3. Under the Activities Calendar Reporting Menu, choose the activity you would like to see a report of. The default is currently set to assignment as this is felt to be most used. You can select multiple activities if needed.
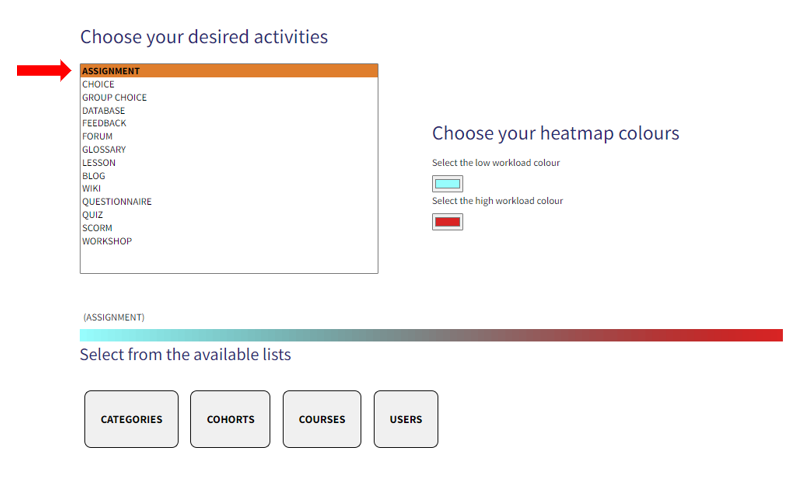
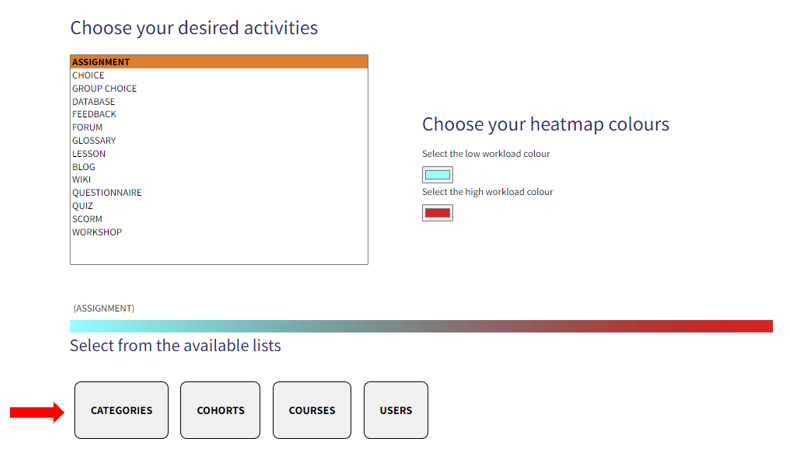
4. Once you have selected the activity of your choice, select from the type of list you would like to see.
6. Select the date range you would like to see the activities ‘From’ and ‘To’.
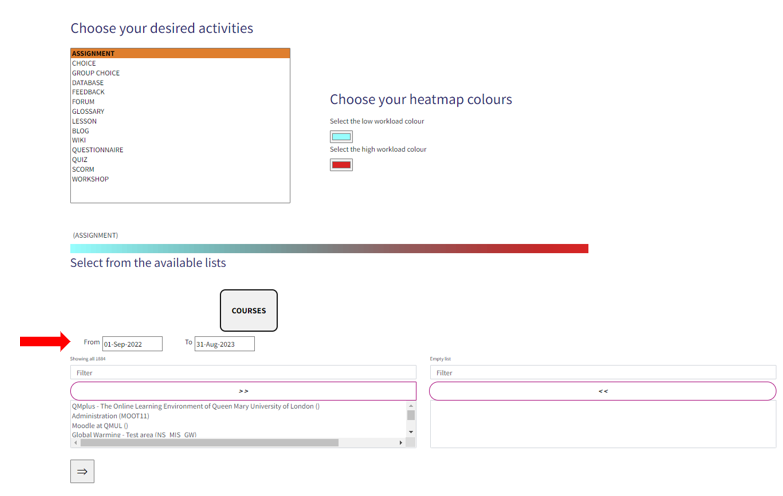
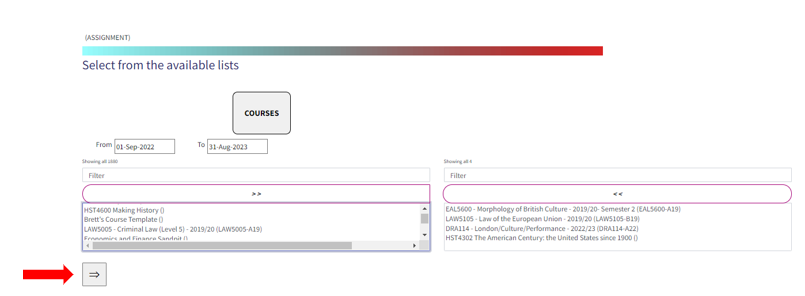
7. Select the course/s in question using the control option to select multiple courses, then click on the arrow button to generate the reports. You can, if needed, use the filters to narrow down your course lists.
Viewing the reports
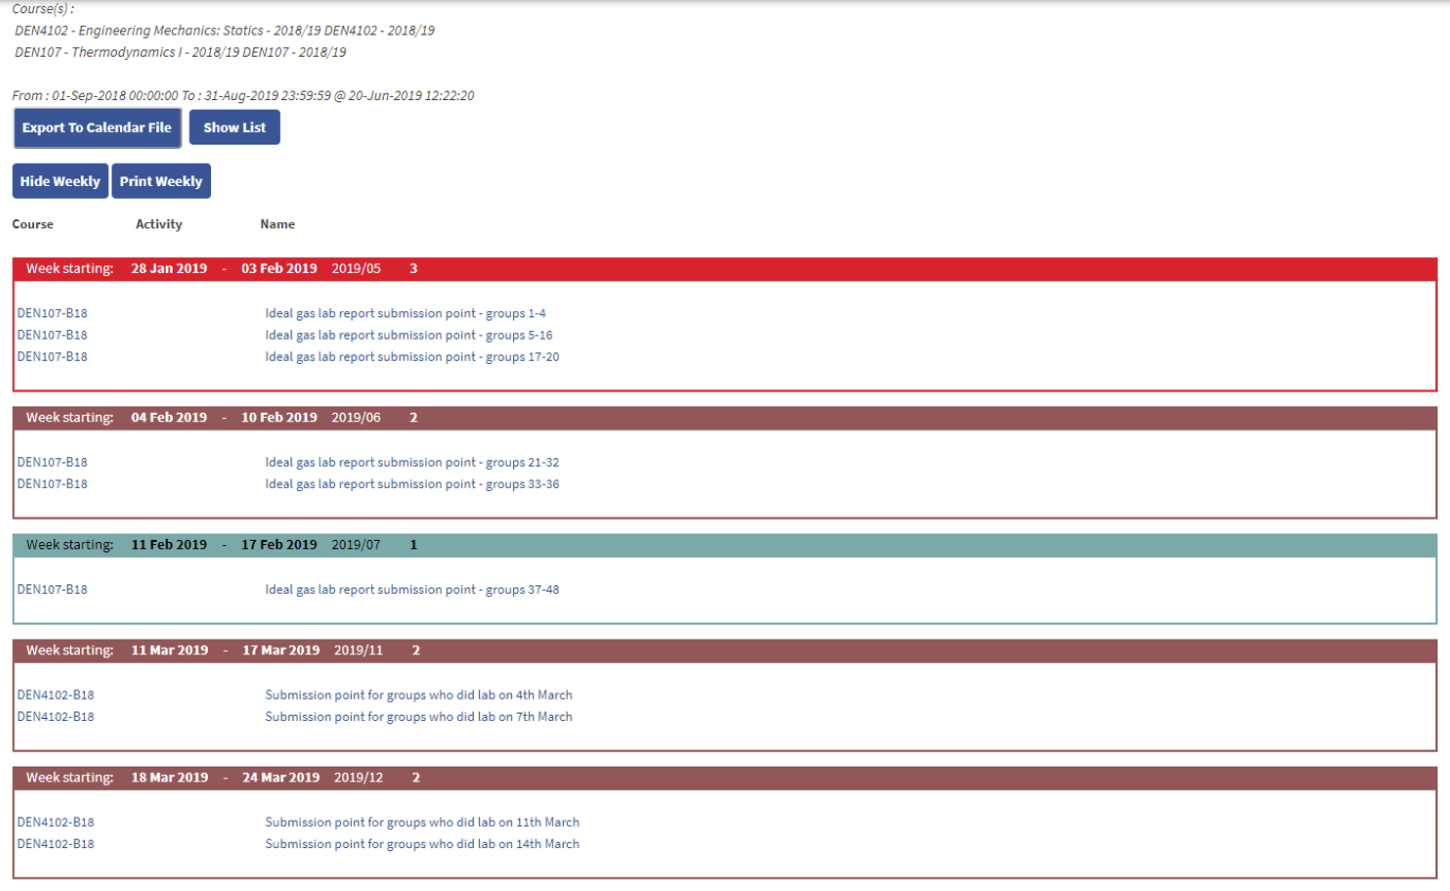
8. You will now be able to view the reports of your desired activities. Sections highlighted in red indicate a possible ‘pinch point’ where there is more than one assignment due.
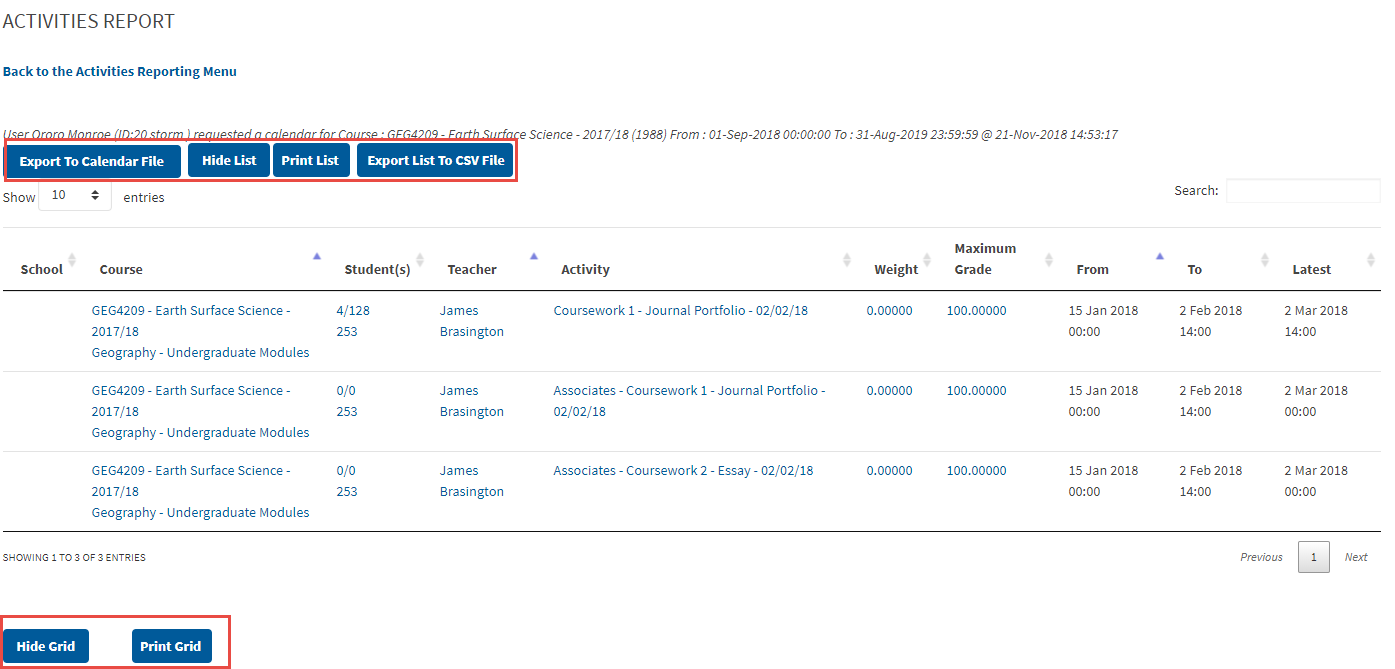
Here you will be able to view multiple entries and export these entries into a calendar file or a CSV file if preferred. You can also hide this list or print if required. On the right hand side use the search navigation to search through a large number of entries.
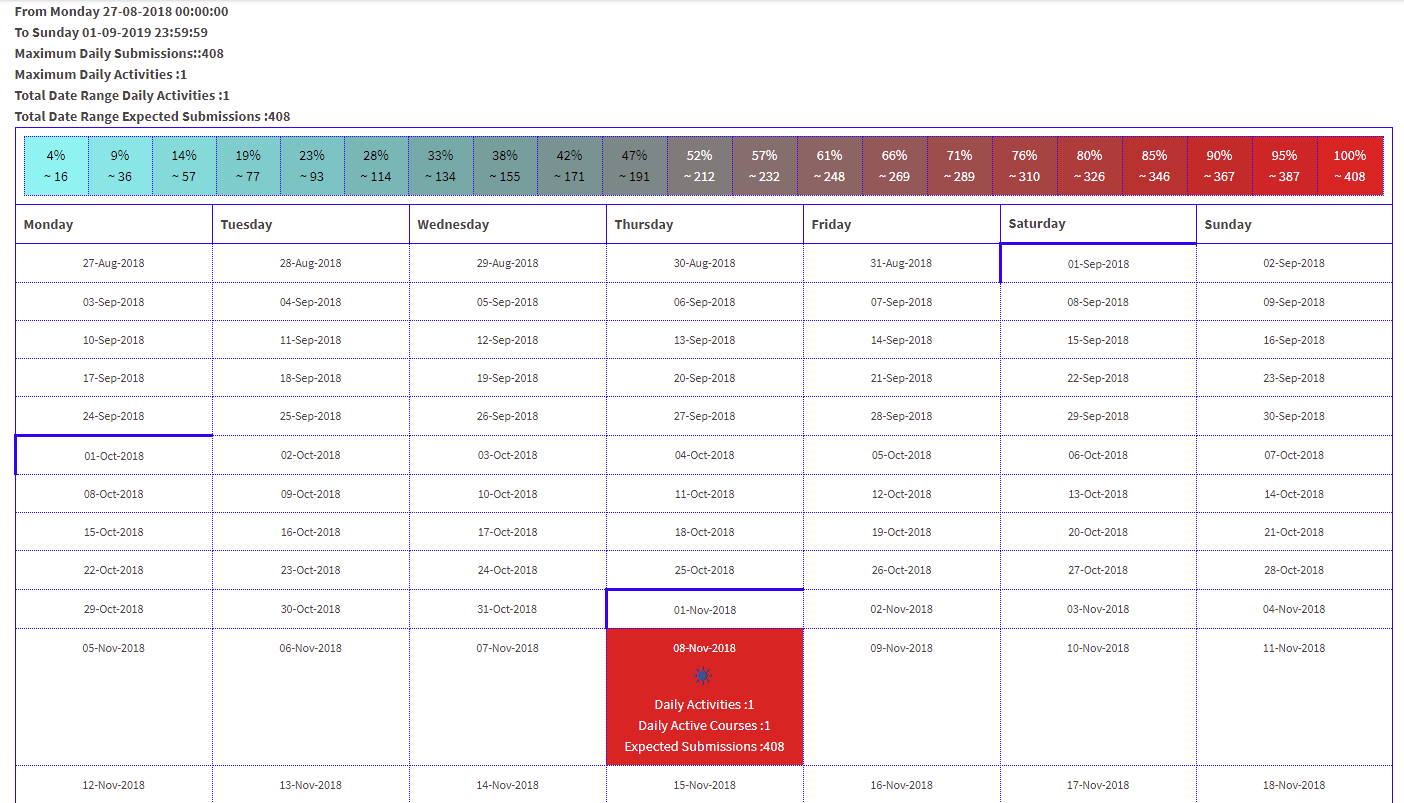
9. Once you scroll down you will have the option of viewing the activity calendar which shows a heatmap (the colours of the heat map represent the total number of students, e.g. 408 below)
10. As seen below there is a one sun representing 1 activity involving ALL students due on the 8th November 2018. If there are multiple activities on a particular date this will be represented with multiple suns as well as a darker colour when involving larger numbers of students.
This same report can be used to investigate submission pinchpoints for an individual student by choosing them at step 7.
